Graph the linear inequality in two variables.x + y < -5
A. 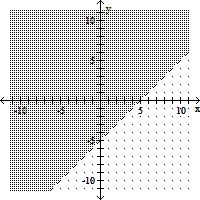
B. 
C. 
D. 
Answer: C
Mathematics
You might also like to view...
For the following data table, complete the table of changes, and determine if the data can be modeled exactly by a linear function. Round your answer to two decimal places, if necessary. x 3 8 13 18 y 25.14 14.24 3.34 -7.56? Change in x From 3 to 8 From 8 to 13 From 13 to 18 Change in y
What will be an ideal response?
Mathematics
Use the limit comparison test to determine if the series converges or diverges.
A. Converges B. Diverges
Mathematics
Find the limit.

A. 10
B. 7
C. 
D. 
Mathematics
Find the radius of convergence and the interval of convergence of the power series.
 Figure 3.png)
Mathematics