Complete the following:(a) Use the Leading Coefficient Test to determine the graph's end behavior.(b) Find the x-intercepts. State whether the graph crosses the x-axis or touches the x-axis and turns around at each intercept.(c) Find the y-intercept.(d) Graph the function.f(x) = x2(x + 3)
What will be an ideal response?
(a) falls to the left and rises to the right
(b) x-intercepts: (0, 0), touches x-axis and turns; (-3, 0), crosses x-axis
(c) y-intercept: (0, 0)
(d) 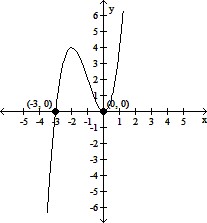
You might also like to view...
Complete the table for the function and find the indicated limit.If f(x) =  , find
  f(x)
f(x)
A. 3.97484; 3.99750; 3.99975; 4.00025; 4.00250; 4.02485 f(x) = 4
B. 4.07484; 4.09750; 4.09975; 4.10025; 4.10250; 4.12485 f(x) = 4.1
C. 1.19245; 1.19925; 1,19993; 1.20007; 1.20075; 1.20745 f(x) = 1.2
D. 5.07736; 5.09775; 5.09978; 5.10022; 5.10225; 5.12236 f(x) = 5.1
Use the Change-of-Base Formula and a calculator to evaluate the logarithm. Round your answer to two decimal places.log5.8 164
A. 2.21 B. 2.90 C. 28.28 D. 0.34
Graph.y = log3 x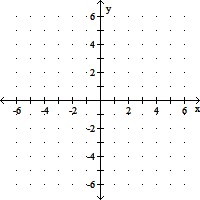
A. 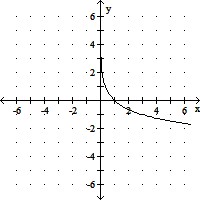
B. 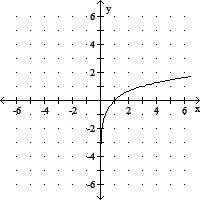
C. 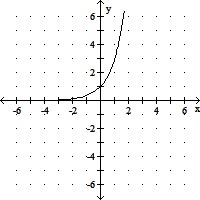
D. 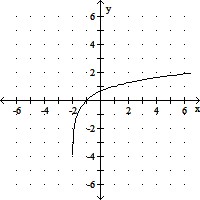
Solve the problem.A map has a scale of 3 miles to the inch. How far apart in reality are two cities that are 21 inches apart on the map?
A. 54 in. B. 63 mi. C. 6 in. D. 7 mi.