Refer to the above graph, which shows the market for beef where demand shifted from D 1 and D 2. The change in equilibrium from E1 to E 2 is most likely to result from:
A decrease in the tax on beef products
An increase in the price of pork
A decrease in consumer incomes
An increase in the cost of cattle feed
A decrease in consumer incomes
You might also like to view...
If an economy is producing inefficiently, it is
a. possible to increase production of all goods simultaneously. b. possible to increase production of one good at the expense of another. c. not possible to increase production of any good. d. not possible to increase economic growth. e. possible to increase production with no effort.
When the Fed uses monetary policy targets, they cannot use both a money supply target and an interest rate target at the same time because
A. It is easier for the Fed to keep track of, and influence, the interest rate B. Interest rates are determined by money supply and money demand that the Fed does not control money demand C. The Fed is only allowed to choose one target at a time to publish the Congress
Refer to the information provided in Figure 2.4 below to answer the question(s) that follow.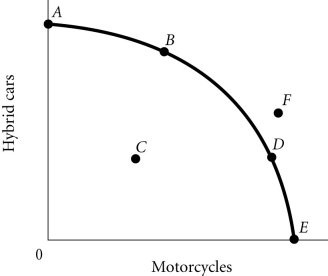 Figure 2.4According to Figure 2.4, Point E necessarily represents
A. only motorcycles being produced. B. overallocation of resources. C. an impossible production point. D. technological advancement.
Refer to the information provided in Figure 30.2 below to answer the question(s) that follow.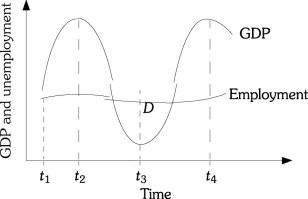 Figure 30.2Refer to Figure 30.2. Labor productivity at time t2 is
A. larger than labor productivity at time t1. B. larger than labor productivity at time t1, but less than labor productivity at time t3. C. less than labor productivity at time t3. D. less than labor productivity at time t4.