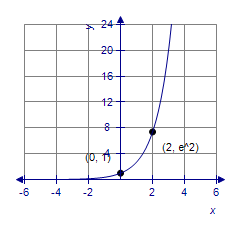
Find the value of b that would cause the graph of y = bx to look like the graph below.
?
?
A. 
B. 
C. 
D. 
E. 
Answer: C
You might also like to view...
Solve the problem.dy/dt = ky + f(t) is a population model where y is the population at time t and f(t) is some function to describe the net effect on the population. Assume k = 0.02 and  when t = 0. Solve the differential equation of y when f(t) = 2t.
A. y = -100t - 5000 + 15,000e-0.02t B. y = -100t - 5000 + 15,000e0.02t C. y = 100t - 5000 + 15,000e-0.02t D. y = 100t + 5000 + 15,000e-0.02t
Multiply.(w - 3)2
A. w2 - 6w + 9 B. w + 9 C. 9w2 - 6w + 9 D. w2 + 9
Solve the triangle.a = 19, b = 16, c = 11
A. A = 87.4°, B = 35.3°, C = 57.3° B. A = 87.4°, B = 57.3°, C = 35.3° C. A = 35.3°, B = 57.3°, C = 87.4° D. A = 57.3°, B = 87.4°, C = 35.3°
Divide. Round your answer to the nearest hundredth when necessary.1.92 ÷ 4
A. 4.8 B. 1.48 C. 14.8 D. 0.48