Refer to the information provided in Figure 5.7 below to answer the question(s) that follow.
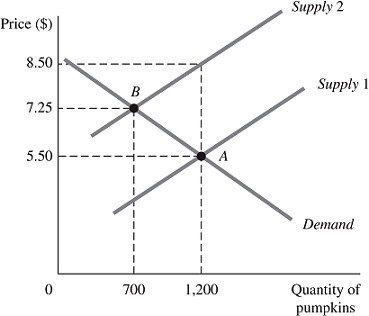 Figure 5.7The above figure represents the market for pumpkins both before and after the imposition of an excise tax, which is represented by the shift of the supply curve.Refer to Figure 5.7. The amount the store owners will receive per pumpkin after paying the tax is
A. $1.75.
B. $3.00.
C. $4.25.
D. $7.25.
Answer: C
You might also like to view...
Many economists estimate that for every 10% increase in relative minimum wage rates, there is a corresponding decrease in employment of those affected equal to
A) 5-10%. B) 1-2%. C) 10-20%. D) 30-40%.
If $1 is worth .8 Canadian dollars, then 1 Canadian dollar is worth:
A. $1.25. B. $1.80. C. $0.20. D. $0.80.
Capitalism and free enterprise are common, and the United States
a. has just begun to move in that direction after years of central planning. b. has gone further in that direction than almost any other country. c. is becoming more "free," but is not as capitalistic as many others. d. is considering a major change to "free up" its economy as many others have. e. is leading the move toward greater central planning and control.
The age-earnings profile predicts that earnings will peak at
A. the 35-40 age level. B. the 45-50 age level. C. the 60-65 age level. D. retirement.