Graph the solution of the system of linear inequalities.
A. 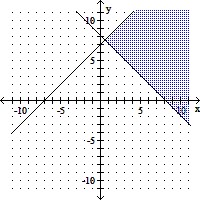
B. 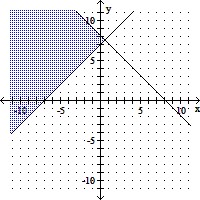
C. 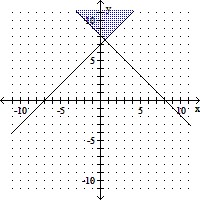
D. 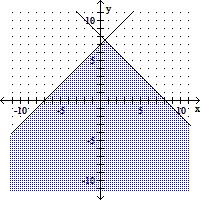
Answer: C
Mathematics
You might also like to view...
Show the solution set of each inequality on a number line.-2 < x < 2![]()
A. ![]()
B. ![]()
C. ![]()
D. ![]()
Mathematics
Graph the function.y =log1/5x
A. 
B. 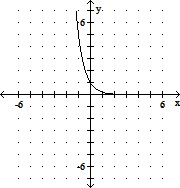
C. 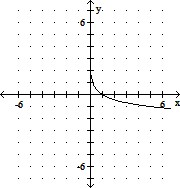
D. 
Mathematics
Graph the system of inequalities. Shade the region that represents the solution set.x2 + y2 ? 81x + y > 4
A. 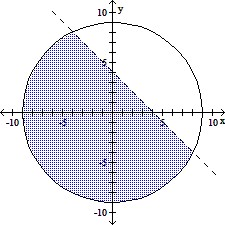
B. 
C. 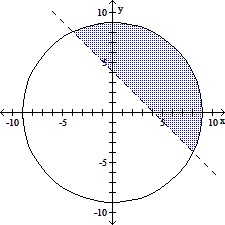
D. 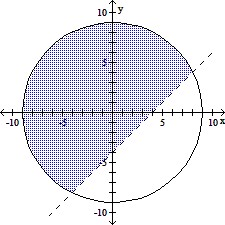
Mathematics
Use the circle graph to solve the problem.A survey of the 7247 vehicles on the campus of State University yielded the following circle graph.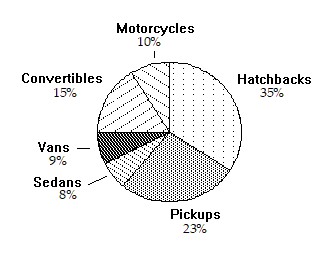 Together, what percent of the vehicles are either vans or convertibles?
A. 6% B. 135% C. 15% D. 24%
Mathematics