Write as a percent.0.03
A. 0.3%
B. 30%
C. 3%
D. 0.003%
Answer: C
You might also like to view...
Data that has been sorted into a frequency distribution can then be graphed easily using a
A. line graph B. histogram C. frequency polygon D. bar graph
Solve. Assume the exercise describes a linear relationship.A gas station sells 4820 gallons of regular unleaded gasoline in a day when they charge $1.35 per gallon, whereas they sell 3935 gallons on a day that they charge $1.40 per gallon. Find a linear equation that relates gallons sold to price. Use this equation to predict the number of gallons sold at a price of $1.21 per gallon.
A. 7307 gal B. 7294.7 gal C. 7302.1 gal D. 7298 gal
Provide an appropriate response.Find the area of the shaded segment of the given circle. 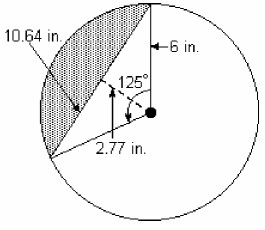
A. 8.95 in2 B. 39.27 in2 C. 24.53 in2 D. 14.74 in2
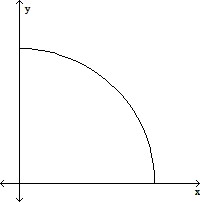
Match the function with the graph that best describes the situation.The height of an animal as a function of time.
A. 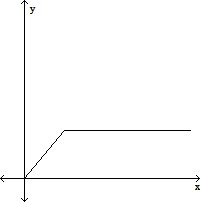
B. 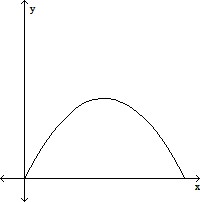
C. 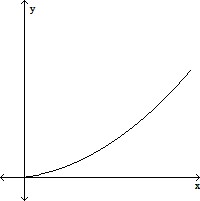
D.