The line graph shows the recorded hourly temperatures in degrees Fahrenheit at an airport. Use the graph to answer the question.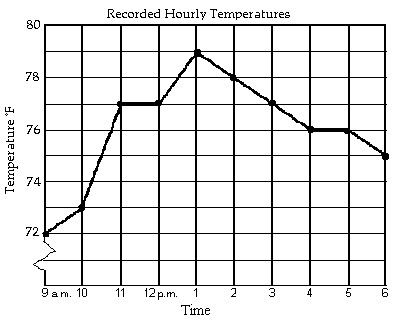 At what time was the temperature the lowest?
A. 10 a.m.
B. 1 p.m.
C. 6 p.m.
D. 9 a.m.
Answer: D
Mathematics
You might also like to view...
Assume triangle ABC has standard labeling. Determine if AAS, ASA, SSA, SAS, or SSS is given, and decide if the law of sines or the law of cosines should be used to solve the triangle.a, b, and ?
A. AAS; law of cosines B. SSS; law of cosines C. SSA; law of sines D. SAS; law of cosines
Mathematics
The graph of a function f is provided. Determine the requested function value.f(-4)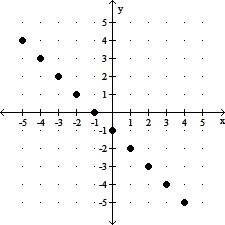
A. 3 B. -5 C. -3 D. 5
Mathematics
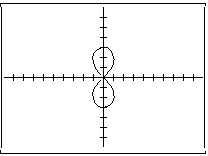
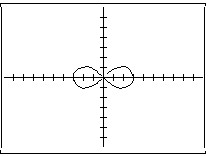
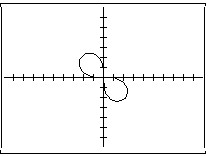
Use a graphing utility to graph the polar equation.r2 = 9 sin(2?)6
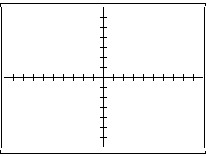
 -6
-6
A.
| 6 |

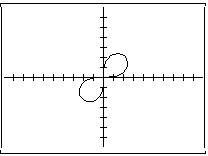

| -6 |
B.
| 6 |


| -6 |
C.
| 6 |


| -6 |
D.
| 6 |


| -6 |
Mathematics
Perform the indicated operations.-11 + 15 + 1
A. -27 B. 3 C. -25 D. 5
Mathematics