For the given complex number, graph the terminal point of the associated vector.7 +  i
i
A. 
B. 
C. 
D. 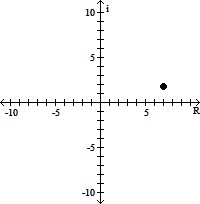
Answer: D
You might also like to view...
Beginning in 2001 the price, in dollars per ounce, of gold was modeled approximately by
 ,
where t is the time in years since the beginning of 2001.A: Make a graph of G versus t that shows estimated gold prices for 2001 to 2010.B: A broker recommended purchase of gold as long as the price was between $400 and $700 per ounce. Add the horizontal lines
,
where t is the time in years since the beginning of 2001.A: Make a graph of G versus t that shows estimated gold prices for 2001 to 2010.B: A broker recommended purchase of gold as long as the price was between $400 and $700 per ounce. Add the horizontal lines  and
and  to your graph.C: During what time period was the purchase of gold advised? Give your answer in terms of t correct to two decimal places.
What will be an ideal response?
to your graph.C: During what time period was the purchase of gold advised? Give your answer in terms of t correct to two decimal places.
What will be an ideal response?
Determine whether the graph is the graph of a function.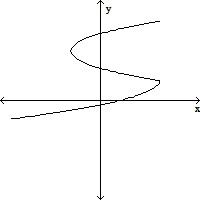
A. Function B. Not a function
Evaluate using a calculator. Express answers to the nearest ten-thousnadth.ln 0.987
A. -0.0131 B. 0.0131 C. -0.0057 D. 0.0057
Provide an appropriate response.The product of two negative numbers is negative.
A. True B. False