Exhibit 3-3 Demand curves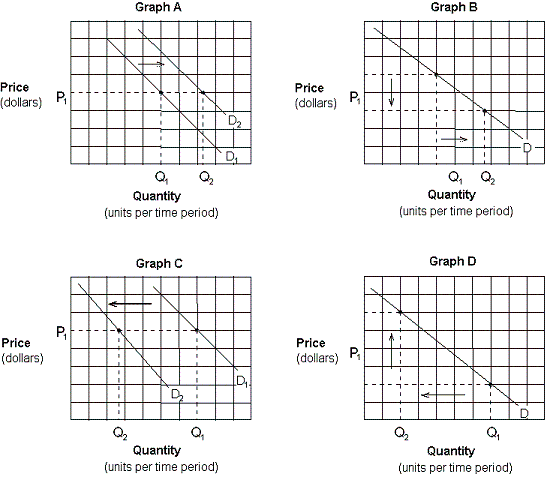
Assume that consumers expect the price of gasoline to rise sharply in the future. Which of the graphs in Exhibit 3-3 depicts this effect?
A. Graph A.
B. Graph B.
C. Graph C.
D. Graph D.
Answer: A
You might also like to view...
The supply of loanable funds curve shifts leftward if the real interest rate rises
Indicate whether the statement is true or false
Elasticity provides a guide to both
A. market stability and change in revenue as price changes. B. responsiveness of quantity demanded to a change in price and market stability. C. responsiveness of quantity demanded to a change in price and change in revenue as price changes. D. technological change and change in revenue as price changes.
Long-run economic growth policies focus on:
A. Shifting the aggregate demand curve to the left. B. Moving the economy along the production possibilities curve. C. Shifting the production possibilities curve outward. D. Moving the economy onto the production possibilities curve.
What is true about the following payoff matrix? A: not cooperateA: cooperateB: do not cooperateA: 2, B: 2A: 1, B: 3B: cooperateA: 3, B: 1A: 0, B: 0
A. Only player A has a dominant strategy. B. Only player B has a dominant strategy. C. Both player A and player B have dominant strategies. D. Neither player A nor player B has a dominant strategy.