The figure above shows the labor demand and labor supply curves for workers in local fast-food restaurants. The fast-food restaurant industry is competitive. A decrease in the supply of labor shifts the labor supply curve from LS0 to LS1
Fast-food restaurants hire ________ and total labor income earned by the fast-food workers ________. A) 40 hours of labor a day; increases
B) 30 hours of labor a day; decreases
C) 40 hours of labor a day; decreases
D) 30 hours of labor a day; increases
D
You might also like to view...
The figure above provides information about Light-U-Up Utilities, which is a natural monopoly that provides electricity. What is the area of deadweight loss when Light-U-Up produces the unregulated, profit-maximizing level of output?
A) abd B) acg C) deg D) There is no deadweight loss.
A monopoly is a
a. large number of producers each with a small share of the total market output b. single seller of a product that typically has no close substitutes c. small group of producers with similar products d. single buyer of an input into production e. group of firms with incentives to cooperate
A general formula for the multiplier is
A) 1/(1-MPS) B) 1/(MPC) C) 1/(MPS) D) 1/(MPC-1)
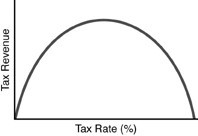 Consider the above figure. The curve shown is sometimes referred to as
A. the Phillips curve. B. the Laffer curve. C. the Keynesian curve. D. the Ricardian curve.