Refer to the graphs shown. The curve that best illustrates the law of supply is: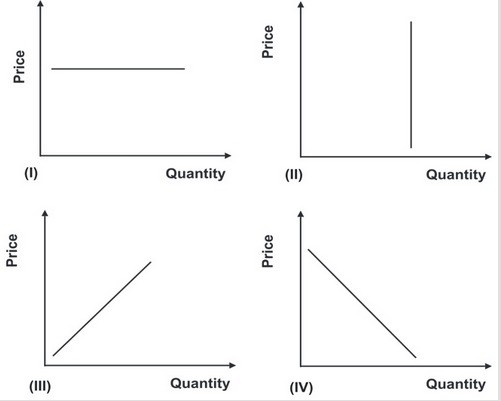
A. I.
B. II.
C. III.
D. IV.
Answer: C
You might also like to view...
"Housing starts" is __________ indicator
A) a leading B) a coincident C) a lagging D) an inconsistent
Four possibilities have probabilities 0.4, 0.2, 0.2 and 0.2 and values $10, $20, $30, and $40 respectively. The expected value is:
a. $22 b. $24 c. $26 d. $28
The lower portion of the circular flow model contains factor markets in which households provide:
a. labor, money, and machines. b. savings, spending, and investment. c. natural resources, labor, and capital. d. output of all final goods and services produced.
If the physical plant for a corporation is considered to be a fixed input, then
a. it is held constant in the long run b. it can be changed in the long run c. labor must be a variable input d. technology must be changing e. the firm will lose money in the short run, except under perfect competition