Refer to Figure 3-7. Assume that the graphs in this figure represent the demand and supply curves for laptop computers. Which panel best describes what happens in this market when the price of computer hard drives falls?
A) Panel (a) B) Panel (b) C) Panel (c) D) Panel (d)
A
Economics
You might also like to view...
Given a linear curve, the value on the y-axis changes from 100 to 120 when the value on the x-axis changes from 20 to 10, then the slope of that curve is
A) -20. B) +20. C) -2. D) +2.
Economics
The structural deficit does not depend on the state of the economy.
Answer the following statement true (T) or false (F)
Economics
According to the table shown, which year is most likely being used for the base year?
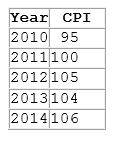
A. 2010
B. 2011
C. 2012
D. 2013
Economics
The nation whose workers work less hours per year than any other industrial nation is
A. the United States. B. Germany. C. Japan. D. Britain.
Economics