Refer to the diagram. At the profit-maximizing output, total profit is:
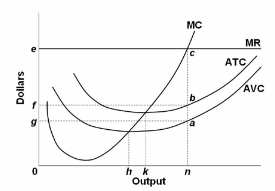
A. efbc.
B. fgab.
C. egac.
D. 0fbn.
A. efbc.
You might also like to view...
If the cross elasticity of demand between two goods is negative, are the goods substitutes or complements?
What will be an ideal response?
Suppose a stock market boom makes people feel wealthier. The increase in wealth would cause people to desire
a. increased consumption, which shifts the aggregate-demand curve right. b. increased consumption, which shifts the aggregate-demand curve left. c. decreased consumption, which shifts the aggregate-demand curve right. d. decreased consumption, which shifts the aggregate-demand curve left.
In this graph, point E2 is a(n) ______ equilibrium point because it ______.
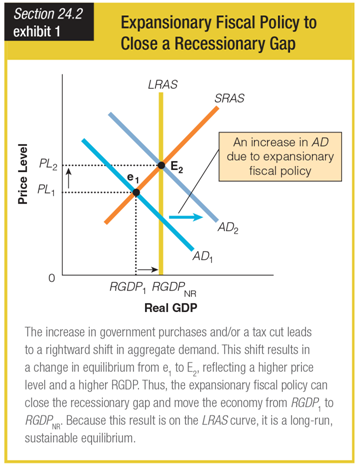
a. sustainable; is on the LRAS curve
b. sustainable; is on the SRAS curve
c. unsustainable; increases output, but not prices from e1
d. unsustainable; increases prices, but not output from e1
Suppose output is $35 billion, government purchases are $10 billion, desired consumption is $15 billion, and desired investment is $6 billion. Desired savings is equal to
A. $2 billion. B. $10 billion. C. $16 billion. D. $14 billion.