Sketch the graph of the rational function.f(x) = 
A. 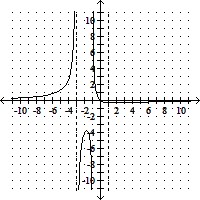
B. 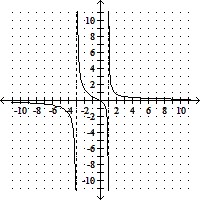
C. 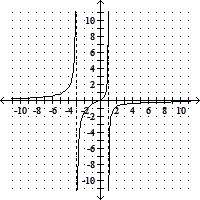
D. 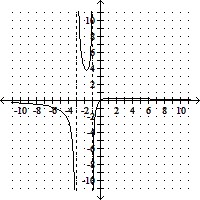
Answer: D
You might also like to view...
Determine the truth value for the simple statement. Then use these truth values to determine the truth value of the compound statement. Use the chart or graph when provided.0 > -7 or 4 ? 10, and -4 ? 7
A. True B. False
List the intercepts of the graph. 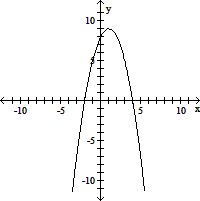
A. (0, -2), (8, 0), (0, 4) B. (-2, 0), (0, 8), (0, 4) C. (0, -2), (0, 8), (4, 0) D. (-2, 0), (0, 8), (4, 0)
Solve the problem.The table shows the population of a city over the past five years. We used these data to develop the quadratic equation
 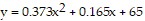 , which models the population of the city y in millions in the year x, where x = 0 represents 1995, x = 1 represents 1996, and so on. Use the model to find the estimated population in the year 1998.
A. 71,628,000 B. 1,490,000 C. 1,490,000,000,000 D. 68,852,000
Write a quadratic equation in standard form with the given solution set.{-5 , 5
, 5 }
}
A. x2 - 10 x + 250 = 0
B. x2 + 10 x - 250 = 0
C. x2 - 250 = 0
D. x2 + 250 = 0