The following pictograph shows the number of bicyclists who participated in the Labor Day weekend bicycle race for the years 2003-2009. Use the graph to answer the question. 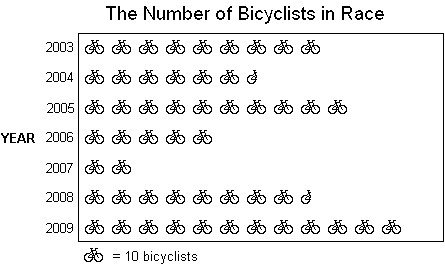 In what years was there an increase in the number of cyclists who participated in the race?
A. 2003, 2005, 2009
B. 2004, 2005, 2009
C. 2005, 2008, 2009
D. 2004, 2006, 2007
Answer: C
Mathematics
You might also like to view...
Evaluate the integral by using multiple substitutions. dt
dt
A. -  + C
+ C
B.  + C
+ C
C.  + C
+ C
D. -  + C
+ C
Mathematics
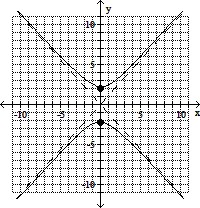
Identify and graph the conic section. Label the center and/or vertex as appropriate. -
-  = 1
= 1
A. hyperbola; center (0, 0);
(- , 0), (
 , 0)
, 0)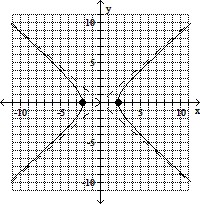
B. hyperbola; center (0, 0);
(-2, 0), (2, 0)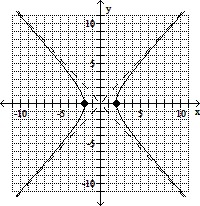
C. ellipse; center (0, 0)
(- , 0), (
 , 0), (0, -2), (0, 2)
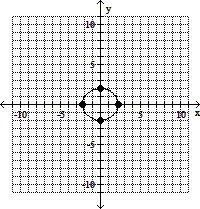
D. hyperbola; center (0, 0);
(0, - ), (0,
  )
)
Mathematics
Write parentheses around the two addends that would be easiest to add. Then find the sum. +
+  + 18
+ 18
A. ( +
+  ) + 18 = 8
B.  + (
+ ( + 18) = 28
C. ( +
+  + 18) = 8
D.  +
+  + 18 =
Mathematics
Evaluate.Given that loga5 = 0.699, and loga2 = 0.301, find loga10
A. 0.489 B. 1 C. 0.21 D. Cannot be found from the given information.
Mathematics