Which of the following illustrations is a line graph?
?
A. 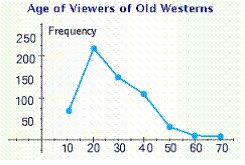
B. 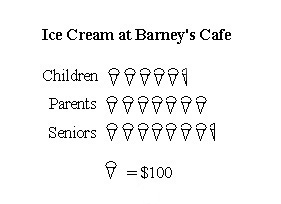
C. 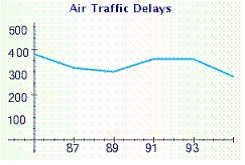
D. 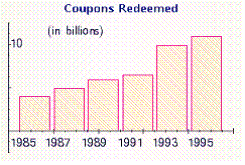
E. 
Answer: C
You might also like to view...
Determine whether the graphs of the equations are parallel lines, perpendicular lines, or neither. 3x - 4y = 5 8x + 6y = 5
A. Parallel B. Neither C. Perpendicular
Solve.In 1997, Little City Productions produced and sold 2939 thousand of its Little City Collectible Bears. In 2003, the number of these bears produced and sold had dropped to 461 thousand. Find the change in the number of bears produced from 1997 to 2003, and find the average change per year in the number of bears produced over this period.
A. change: 2478 thousand bears average change: 413 thousand bears B. change: -2478 thousand bears average change: 413 thousand bears C. change: -2478 thousand bears average change: -413 thousand bears D. change: 2478 thousand bears average change: -413 thousand bears
Find the odds.If two fair dice are thrown, what are the odds of obtaining a sum of 7?
A. 1:6 B. 5:1 C. 1:5 D. 3:4
Solve the system of equations graphically. Round to the nearest hundredth when appropriate.x + y = 1x - y2 = 3
A. (-0.56, 2.56), 
B. (-0.56, 1.56), 
C. (-0.56, -2.56), 
D. No real solutions