 Using Figure 1.4 and starting at PP1, an increase in the capacity to produce can be represented by a movement from point
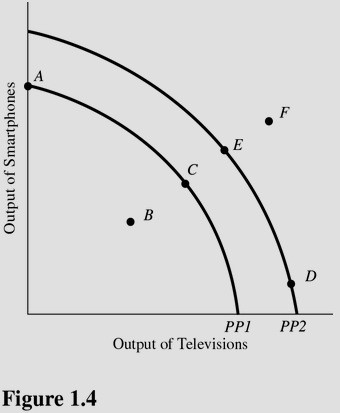
A. A to point B.
B. D to point E.
C. C to point E.
D. A to point C.
Answer: C
You might also like to view...
Refer to the scenario above. What is the opportunity cost of printing one notebook?
A) 0.5 magazines B) 1 magazine C) 2 magazines D) 30 magazines
Each point on a supply curve represents
A) the highest price buyers will pay for the good. B) the lowest price for which a supplier can profitably sell another unit. C) the lowest price buyers will accept per unit of the good. D) the highest price sellers can get for each unit over time.
A resource is defined to be:
A. something that people respond to. B. anything that can be used to make something of value. C. a good or service. D. something of value.
In theory the market's willingness-to-pay (WTP) should be equal to the market's willingness-to-accept (WTA). In other words, if you are willing-to-pay $1 for an incremental improvement in tap water quality, then you should be willing-to-accept $1 for an incremental decrease in tap water quality. In practice, however, the two are often estimated to be unequal. Which of the following helps to explain this disparity?
a. the WTA/WTP disparity b. the endowment effect c. benefit transfer d. value of statistical life e. cost-benefit analysis f. expected value g. risk and uncertainty h. None of the above.