Give the economic interpretation of each of the labeled areas: A, B, C, and D.
Use the following graph of the refined petroleum market to answer the questions below.
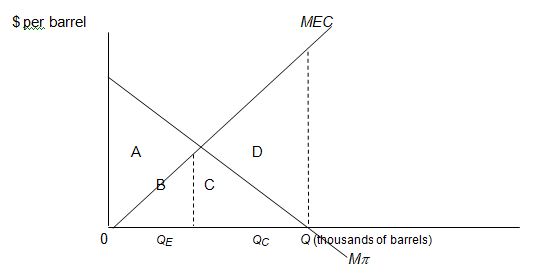
The economic interpretation of each area is as follows:
A Represents the net gain accruing to petroleum refineries (i.e., the excess of their increased profits over the external damages to recreational users), as they negotiate to increase production from 0 to output level QE.
B Represents the total amount of environmental damage associated with producing output level QE.
C Represents the loss of profit to petroleum refiners from reducing output from QC to QE.
D Represents the net gain accruing to recreational users (i.e., the excess of the reduction in damages over the profit loss incurred by producers), as they negotiate to achieve a reduction in output from QC to QE.
You might also like to view...
As Sam moves rightward along his indifference curve, his marginal rate of substitution
A) is diminishing. B) is increasing. C) remains constant. D) shows the change in his income.
An increase in the growth rate of population in a steady-state economy would cause
A) a parallel shift upward in the investment line. B) a pivot up and to the left in the investment line. C) a pivot down and to the right in the investment line. D) a parallel shift downward in the investment line.
Deadweight losses and administrative burdens are key factors considered when determining the efficiency of the tax system
a. True b. False Indicate whether the statement is true or false
A one-time rise in the price level can turn into a demand-pull inflation when...
What will be an ideal response?