The bar graph shows the number of tickets sold each week by the garden club for their annual flower show. Use the graph to answer the question.? During which weeks were the number of tickets sold more than 25?
A. weeks 1, 3, 4, and 5
B. weeks 1, 3, and 4
C. weeks 1, 4, and 5
D. weeks 1, 3, and 5
Answer: A
You might also like to view...
Use a TVM slover to find the APR (true annual interest rate), to the nearest 0.01%, for the loan. Use the Annual Percentage Rate table if necessary.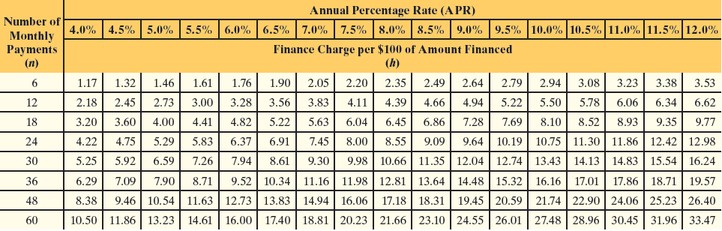 PurchaseDown Payment Add-on# of Payments PriceInterest Rate $6500$29505%48
A. 9.51% B. 8.98% C. 9.24% D. 8.40%
Solve the problem.John owns a hot dog stand. His profit, in dollars, is given by the equation  where x is the number of hot dogs sold. What is the most he can earn?
A. $108 B. $150 C. $87 D. $49
Find the number of subsets of the set.{x | x is an even number between 17 and 37}
A. 8 B. 36 C. 256 D. 1024
Find the area of the indicated region. Round your answer to the three decimal places.
?
Enclosed by  and
and  and
and  .
?
A. 7.839
B. 8.089
C. 7.089
D. 7.339
E. 6.589
.
?
A. 7.839
B. 8.089
C. 7.089
D. 7.339
E. 6.589