Use a graphing calculator to plot the data and find the quadratic function of best fit.An engineer collects data showing the speed s of a given car model and its average miles per gallon M. Use a graphing calculator to plot the scatter diagram. What is the quadratic function of best fit? Round values to the nearest thousandth.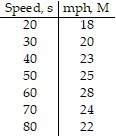
A. M(s) = -6.309x2 + 0.720x + 5.142
B. M(s) = -0.631x2 + 0.720x + 5.142
C. M(s) = 0.063x2 + 0.720x + 5.142
D. M(s) = -0.006x2 + 0.720x + 5.142
Answer: D
You might also like to view...
Use a day counting table to determine the due date of the loan if the loan is made on the given date for the given number of days.February 9 for 60 days (the year is a leap year)
A. April 10 B. March 1 C. April 9 D. April 8
Identify the system as consistent or inconsistent, and dependent or independent.3x = y + 36x - 2y = 3
A. Inconsistent and independent B. Consistent and independent C. Consistent and dependent D. Inconsistent and dependent
Find the cost of goods sold.Initial inventory: $71,000Freight: $1400Cost of goods purchased: $20,000Final inventory: $123,000
A. $92,400 B. $-30,600 C. $-32,000 D. $215,400
Right triangle ABC has  ,
,  , and
, and 
style="vertical-align: middle;" data-wiris-created="true" varid="variable_id_field" variablename="impvar_14455ebf5b3b4469b28aa8009" />. Use this information to find cos A.
?
A. 
B. ?
C. ?
D. ?
E. ?