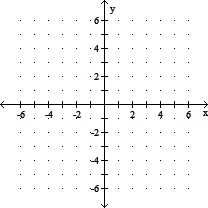
Graph shows the number of sports utility vehicles  sold in the United States. represents sales in year t in thousands of vehicles. Use the graph to estimate the smallest value of
 ![]()
src="https://sciemce.com/media/2/ppg__cognero__1.2_Functions_and_Models__media__62aa7926-15c3-479f-b7e1-544bdf3cef87.PNG" data-wiris-created="true" class="wirisformula" /> for  .
.
?

?
A. 300,000
B. 350,000
C. 850,000
D. 600,000
E. 500,000
Answer: A
You might also like to view...
Solve the system by graphing. If there is no solution or an infinite number of solutions, so state. Use set notation to express the solution set.
A. infinitely many solutions; { x = 7} or {
 x = -6}
B. {(-6, 7)}
C. no solution; ?
D. {(7, -6)}
Solve the problem.Six college buddies bought one another Christmas gifts. They spent $170.21, $277.18, $148.63, $279.72, $285.83, and $149.47. Find the mean amount spent for Christmas gifts.
A. $250.21 B. $327.76 C. $218.51 D. $262.21
Provide an appropriate response.
Draw a right triangle with AC = 2 inches and BC = 1 inch as shown.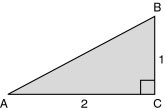 Determine the ratio in lowest terms of tan A.Draw another triangle with AC = 3 inches and BC = 1.5 and determine tan A as a ratio in lowest terms.Draw another triangle with AC = 6 inches and BC = 3 and determine tan A as a ratio in lowest terms.What can you conclude about the measure of angle A in the three triangles? Why?
What will be an ideal response?
Find the area of triangle ABC with the given parts. Round to the nearest tenth when necessary.a = 153 mb = 161 mc = 171 m
A. 14,058 m2 B. 11,246 m2 C. 722 m2 D. 16,869 m2