The following double-bar graph illustrates the revenue for a company for the four quarters of the year for two different years. Use the graph to answer the question. 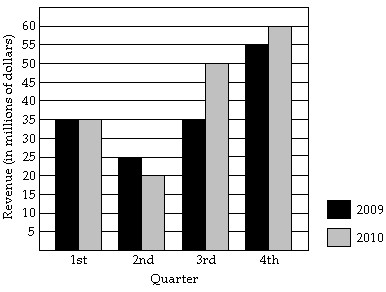 What was the revenue for the second quarter of 2010?
A. $20 million
B. $5 million
C. $4 million
D. $25 million
Answer: A
You might also like to view...
Find the expected value.Mr. Cameron is sponsoring an summer concert. He estimates that he will make $300,000 if it does not rain and make $60,000 if it does rain. The weather bureau predicts the chance of rain is 0.34 for the day of the concert. An insurance company is willing to insure the concert for $150,000 against rain for a premium of $30,000. If he buys this policy, what are his expected earnings from the concert?
A. $180,000 B. $300,000 C. $270,000 D. $239,400
Use an integer to express the number.During one year, 18 employees quit their jobs at Newline Manufacturing Company.
A. 18 B. -18
Determine which diagram is shaded to represent the given fraction.
A. 
B. 
C. 
D. 
Determine if the statement is a proportion.I. 

 II.
II. 


A. I is a proportion, II is not a proportion. B. I is not a proportion, II is a proportion. C. I and II are both proportions. D. Neither I nor II are proportions.