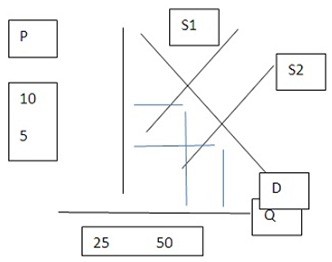
 Assume the graph shown represents the market for pizzas sold in an hour. Which of the following could be a reason S2 to S1?
A. The price of pizza sauce has increased.
B. People just don't have preferences for pizza anymore.
C. The price of pizza went down.
D. The price of labor for pizza shops went down.
Answer: A
You might also like to view...
Scarcity can be measured only through the use of monetary costs.
Answer the following statement true (T) or false (F)
Given the data in Table 6.1, if the workers who are "not employed and not looking for work" were counted as not employed and in the labor force, the unemployment rate of Metropolis would be approximately
A) 4 percent. B) 7 percent. C) 9 percent. D) 10 percent.
The producer surplus on a unit of a good is the
A) difference between the marginal social benefit and the marginal social cost. B) number of dollars' worth of other goods and services forgone to produce this unit of the good. C) difference between the price of the good and the marginal cost of producing the good. D) difference between the total cost of the good and the marginal cost.
Suppose the required reserve ratio is 0.1 and Linda deposits $4,000 in cash at the College State Bank. If the bank held no excess reserves before Linda's deposit and now increases its reserves by $500, which of the following is true? a. The bank must have lent out an additional $4,000. b. $500 is the value of the bank's required reserves
c. The bank now has excess reserves of $100. d. Both the bank's assets and its liabilities rise by $500. e. The bank now has $500 in excess reserves.