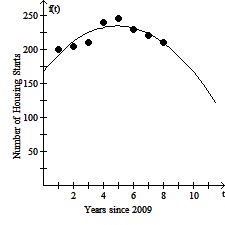
Solve the problem. The following data shows the number of housing starts in various years in one beachside community. 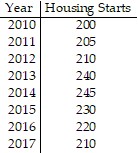 Let f(t) be the number of housing starts at t years since 2009. Use a graphing calculator to draw a scatterplot to describe the data. Using the same viewing window, draw the graph of the quadratic model
 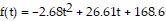 . Use the model to predict when the number of housing starts will be 167.
What will be an ideal response?
The number of housing starts will be 167 in 2019.
You might also like to view...
Solve the problem.A large city is planning to upgrade its existing downtown water distribution system. Water will be fed into the area at the point represented by the vertex labeled A in the graph below. Water must be piped to each of 5 main distribution points, represented by the vertices B through F in the graph. City engineers have estimated the cost of laying the pipes to carry the water between each pair of points in millions of dollars, as indicated on the graph. They must now select which pipes should be laid, so that there is exactly one route for the water to be pumped from A to any one of the five distribution points (possibly via another distribution point), and they want to achieve this at minimum cost. Use Kruskal's algorithm to determine which pipes they should lay. Find
the total cost of laying the pipes you select.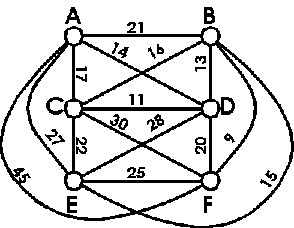
What will be an ideal response?
Graph the equation and state whether the line has a positive or negative slope.y - 4x = 4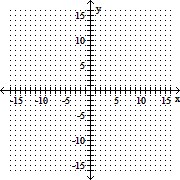
A. Positive slope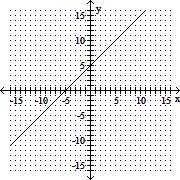
B. Negative slope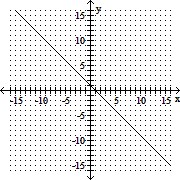
C. Negative slope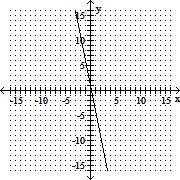
D. Positive slope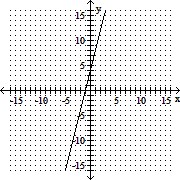
Simplify. -3
-3
A. 
B. 
C. 
D. 
Solve the system using the inverse matrix method.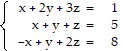
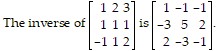
A. x = 2, y = 0, z = 1; (2, 0, 1) B. x = -12, y = 38, z = -21; (-12, 38, -21) C. x = 1, y = 20, z = -16; (1, 20, -16) D. x = 14, y = 44, z = 25; (14, 44, 25)