First, create a scatter plot for the data in the table. Then, use the shape of the scatter plot given to determine if the data are best modeled by a linear function, an exponential function, a logarithmic function, or a quadratic function.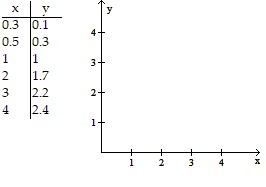
A. 
quadratic function
B. 
logarithmic function
C. 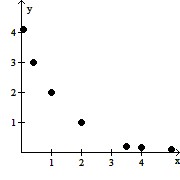
exponential function
D. 
linear function
Answer: B
Mathematics
You might also like to view...
The centroid of a triangle lies at the intersection of the triangle's medians, because it lies one-third of the way from each side towards the opposite vertex. Use this result to find the centroid of the triangle whose vertices appear as following.(0, 0), (2, 0), 
A. 
B. 
C. 
D. 
Mathematics
Find all solutions of the equation in the interval [0, 2?).sin 4x = 
A. {0}
B. 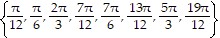
C. 
D. 
Mathematics
The vertical line containing the origin is called the _______________.
Fill in the blank(s) with the appropriate word(s).
Mathematics
Write the repeated multiplication represented by the expression.
?

What will be an ideal response?
Mathematics