A graph of the function f is sketched in the figure below. Use the graph to find the indicated values.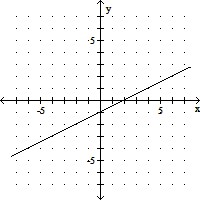 Find f(-2)
A. 4
B. 2
C. 1
D. -2
Answer: D
You might also like to view...
Provide an appropriate response.The range and standard deviation of the data set below are 35 and 12.47 respectively. 5, 24, 25, 26, 40If the 26 is replaced with 39, how will this affect the range? How will this affect the standard deviation. Use your answers to explain why the standard deviation is preferable to the range as a measure of variation.
What will be an ideal response?
Use linear interpolation to find the indicated value.The time required for a sum of money to double in value, when compounded continuously, is given by the following table: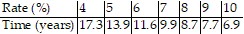 At what rate must a sum be invested in order to double after 12.5 years?
A. 5.55% B. 5.45% C. 5.39% D. 5.61%
Solve the equation.6 + 17x = 0
A. 
B. - 
C. 
D. - 
Solve the problem.April shoots an arrow upward into the air at a speed of 32 feet per second from a platform that is 34 feet high. The height of the arrow is given by the function h(t) = -16t2 + 32t + 34, where t is the time is seconds. What is the maximum height of the arrow?
A. 50 ft B. 16 ft C. 33 ft D. 34 ft