The comparative bar graph below shows the number of male and female athletes at a university over a four-year period. Use the comparative bar graph to answer the question.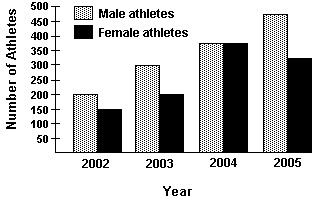 Which year had the smallest number of male athletes? What was the total number of male athletes that year?
A. 2002; 200 athletes
B. 2003; 300 athletes
C. 2002; 150 athletes
D. 2005; 475 athletes
Answer: A
You might also like to view...
Solve by graphing.The value y (in hundreds of dollars) of Juan's computer is approximated by the linear equation  where x is the number of years since he first bought the computer. Graph the equation and use the graph to estimate the value of the computer 2 years after it was purchased.
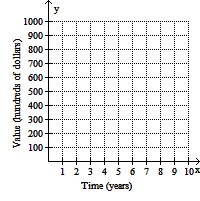
A. $900 B. $760 C. $600 D. $700
Use the square root property to solve the equation. (x - 10)2 = 49
A. {-39} B. {17} C. {3, 17} D. {-3, -17}
Write the rate as a unit rate.Traveling 406 miles on 14 gallons of gas
A. 29 mi/gal B. 420 gal C. 5684 mi D. 0.034 mi/gal
Find the exact value of the trigonometric expression without the use of a calculator.sin 75°
A. - 
B. 
C. 
D. - 