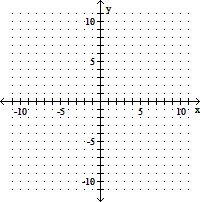
Graph the function by plotting points.H(x) = 
A. 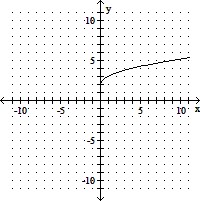
B. 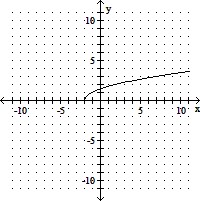
C. 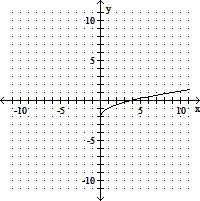
D. 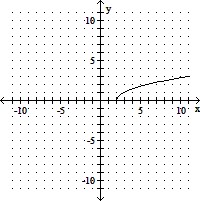
Answer: D
You might also like to view...
Use the maximum/minimum finder on a graphing calculator to determine the approximate location of all local extrema.f(x) = 0.1x5 + 5x4 - 8x3- 15x2 - 6x - 6
A. Approximate local maxima at -41.176 and -0.359; approximate local minima at -0.601 and 1.996 B. Approximate local maxima at -41.228 and -0.266; approximate local minima at -0.638 and 1.959 C. Approximate local maxima at -41.226 and -0.211; approximate local minima at -0.476 and 1.881 D. Approximate local maxima at -41.132 and -0.273; approximate local minima at -0.547 and 1.952
Express the area of the region bounded by the given line(s) and/or curve(s) as an iterated double integral.The lines  ,
,  , and
, and 
A. 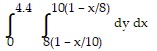
B. 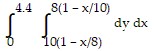
C. 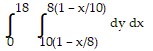
D. 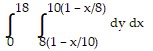
Provide an appropriate response. = 1
= 1
A. 1
B. 
C. 4
D. 2
Find f.
