Choose the inequality that matches the graph.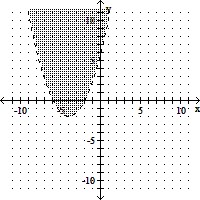
A. y >  x2 + 4x + 6
B. y ?  x2 + 4x + 6
C. y ?  x2 + 4x + 6
D. y <  x2 + 4x + 6
Answer: A
You might also like to view...
Write the logarithmic equation as an exponential equation.log327 = x
A. 273 = x B. 3x = 27 C. x3 = 27 D. 27x = 3
Solve the problem.The table shows the population of a certain city in various years. The data can be modeled by an exponential function of the form  Use regression to determine an exponential function f that models this data. Round the coefficients to the nearest hundredth.
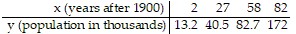
A. f(x) = (0.62)(7.58)x B. f(x) = (13.21)(1.03)x C. f(x) = (7.58)(0.62)x D. f(x) = (14.21)(1.03)x
Find the relative maximum and minimum values and the saddle points if they exist.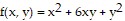
A. Relative minimum = 
B. Saddle point = 
C. Saddle point =  relative maximum =
D. Relative maximum = 
Find the sum of the odd integers between 10 and 66.
a. 1,064 b. 1,081 c. 1,170 d. 1,094 e. 1,092