Use the figure to answer the question.The wages of the employees of a company are presented in this histogram. Assume that $6 is in the interval $6-$8, not $4-$6, similarly for $8, $10, and $12. How many employees earn at least $4 and less than $6 an hour?
A. 10
B. 20
C. 22
D. 34
Answer: B
Mathematics
You might also like to view...
Find the interval of convergence of the series.
A. 2 < x < 4 B. x < 9 C. -9 < x < 9 D. -3 < x < 9
Mathematics
Solve.A $3300 computer is on sale at 5% off. Find the sale price.
A. $3135.00 B. $165.00 C. $16.50 D. $3283.50
Mathematics
Use the graph of y =  to solve the equation
  where
where  and y2 represent linear functions.
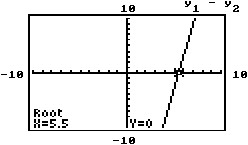
A. {6} B. {5.5} C. {5} D. {0}
Mathematics
Find the quotient.-47.4 ÷ (-6)
A. - 
B. 7.9
C. 6.1
D. - 7.9
Mathematics