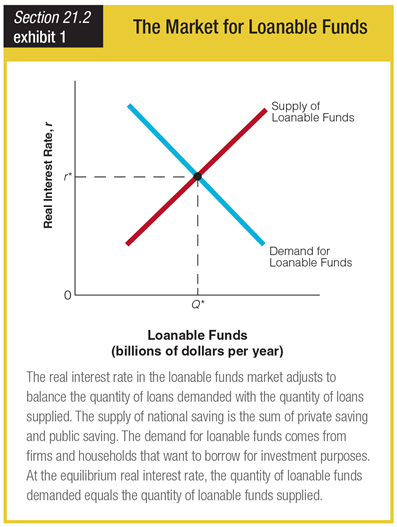
Based on the graph showing the market for loanable funds, at a real interest rate that is higher than equilibrium, the quantity of loanable funds supplied is ______.
a. equal to the quantity of loanable funds demanded
b. less than the quantity of loanable funds demanded
c. greater than the quantity of loanable funds demanded
d. closer to the quantity of loanable funds demanded than at equilibrium
c. greater than the quantity of loanable funds demanded
You might also like to view...
If a commercial bank has liabilities valued at $150 million, a net worth of $50 million and assets (not including loans) of $180 million, what is the value of the bank's loans?
a. $180 million b. $200 million c. $20 million d. $280 million e. $80 million
Refer to the following payoff matrix:Player 1Player 2??Low QHigh Q?Low Q$10,$35$25,$30?High Q$30,$7$20,$6Suppose the production game depicted in the payoff matrix is a sequential-move game. Identify the strategy leading to a first-mover advantage for player 2.
A. Player 2 moves first and plays High Q. Observing player 2's move, player 1's best response is to play Low Q. B. Player 2 moves first and plays High Q. Observing player 2's move, player 1's best response is to play High Q. C. Player 2 moves first and plays Low Q. Observing player 2's move, player 1's best response is to play Low Q. D. Player 2 moves first and plays Low Q. Observing player 2's move, player 1's best response is to play High Q.
On May 12, 2011, it cost U.S. $1.64 to buy 1 British pound. How many British pounds would U.S. $1 buy?
A. 0.56 B. 0.61 C. 1.64 D. 2.64
If the CPI in 2015 was 104.5 and the CPI in 2016 was 110.5, then the rate of inflation between 2015 and 2016 was
A. 5.4%. B. 5.7%. C. 6.5%. D. 7.0%.