List all equally likely outcomes in the sample space for the indicated experiment.A box contains 3 blue cards numbered 1 through 3, and 4 green cards numbered 1 through 4. List the sample space of picking a blue card followed by a green card.
A. {(3, 4)}
B. {(1, 1), (1, 2), (1, 3), (1, 4),
(2, 1), (2, 2), (2, 3), (2, 4),
(3, 1), (3, 2), (3, 3), (3, 4)}
C. {(1, 2, 3, 4)}
D. {(1, 1), (1, 2), (1, 3), (2, 1),
(2, 2), (2, 3), (3, 1), (3, 2),
(3, 3), (4, 1), (4, 2), (4, 3)}
Answer: B
You might also like to view...
Write the inequality using interval notation. Graph the inequality.2 < x ? 6![]()
A. [2, 6)![]()
B. (2, 6)![]()
C. [2, 6]![]()
D. (2, 6]![]()
Provide an appropriate response.The manager of a restaurant recorded the number of days each of the employees was off sick during 2005. The results were as follows: src="https://sciemce.com/media/4/ppg__rrrrrr0615191112__f1q132g3.jpg" alt="" style="vertical-align: 0.0px;" height="27" width="207" /> Number of sick days in 2006 
 In 2006 the manager reduced the length of the employees' shifts from 8.5 to 7.5 hours. He then recorded the number of days each of the employees was off sick during 2005. The results were as follows: 6 0 3 3 1 4 5 0 7 2 1 3 0 2 5Draw two separate, but parallel, dot plots for these two sets of data. Number of sick days in 2005
![]()
A. Number of sick days in 2005
Number of sick days in 2006
B. Number of sick days in 2005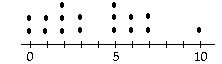
Number of sick days in 2006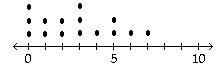
C. Number of sick days in 2005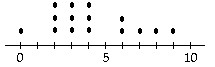
Number of sick days in 2006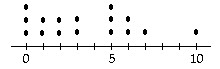
D. Number of sick days in 2005
Number of sick days in 2006
Solve the inequality graphically, numerically, or symbolically, and express the solution in interval notation. Where appropriate, round to the nearest tenth. > 2
> 2
A. (-?, -3.7) ? (-2.3, ?) B. (-3.7, -2.3) C. (-2.3, -3.7) D. (-?, -2.3) ? (-3.7, ?)
Find the average rate of change for the function over the given interval.y = 4x2 between x = 0 to x = 
A. 2
B. - 
C. 
D. 7