The circle graph below shows the number of pizzas consumed by college students in a typical month. Use the graph to answer the question. 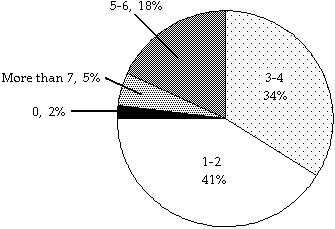 If State University has approximately 45,000 students, about how many would you expect to consume 5-6 pizzas in a typical month?
A. 15,300 students
B. 810 students
C. 1530 students
D. 8100 students
Answer: D
Mathematics
You might also like to view...
Evaluate the determinant.
A. -102 B. -72 C. 72 D. 42
Mathematics
Solve the problem.Suppose that the x-intercepts of the graph of y = f(x) are 8 and 7. What are the x-intercepts of 
A. 17 and 16 B. 8 and 16 C. -1 and -2 D. 72 and 63
Mathematics
Graph the inequality.x > 0![]()
A. ![]()
B. ![]()
C. ![]()
D. ![]()
Mathematics
Write the equation in polar form.x = -9
A. r = -9 csc ? B. r = -9 cos ? C. r = -9 sin ? D. r = -9 sec ?
Mathematics