The following pictograph shows the number of bicyclists who participated in the Labor Day weekend bicycle race for the years 2003-2009. Use the graph to answer the question. 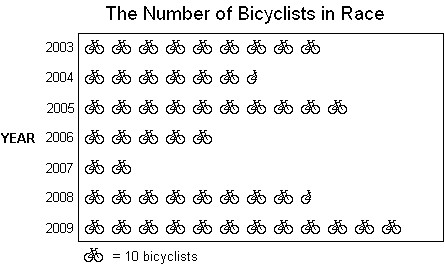 What was the increase in the number of participants from 2007 to 2008?
A. 60 cyclists
B. 70 cyclists
C. 65 cyclists
D. 75 cyclists
Answer: C
Mathematics
You might also like to view...
Provide an appropriate response.Solve the equation by factoring: x2 - 20 = x
A. x = -4, 5 B. x = 4, -5 C. x = -4, -5 D. x = 1, -19
Mathematics
Provide an appropriate response.Correct and explain the error that a student made when he added 0.11 + 1 + 50.1 this way:  5 2.2
5 2.2
What will be an ideal response?
Mathematics
Subtract the fractions. Write the answer in lowest terms.
A. 
B. 
C. 
D. 
Mathematics
Use the vertex and intercepts to sketch the graph of the quadratic function.f(x) = 4 - (x - 2)2 
A. 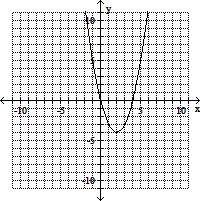
B. 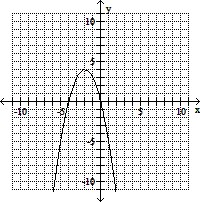
C. 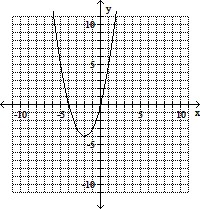
D. 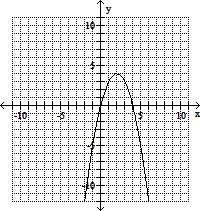
Mathematics