First, create a scatter plot for the data in the table. Then, use the shape of the scatter plot given to determine if the data are best modeled by a linear function, an exponential function, a logarithmic function, or a quadratic function.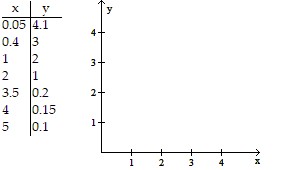
A. 
exponential function
B. 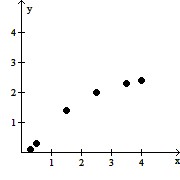
logarithmic function
C. 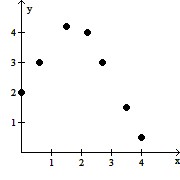
quadratic function
D. 
linear function
Answer: A
You might also like to view...
Find all the first order partial derivatives for the following function.f(x, y) = ln yx
A.  = ln y;
  = - xln y
B.  = xln y;
  = -
= - 
C.  = ln y;
  =
= 
D.  = 0;
= 0;  = -
= - 
Solve the problem. Round to the nearest cent.Find the present value that will generate $4900 in 2 years paying an APR of 4% compounding annually.
A. $5299.84 B. $369.67 C. $4530.33 D. $4711.54
Solve the problem.In one city, the temperature in Fahrenheit on a typical summer day can be approximated by the following function:
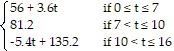 Here, t represents the number of hours since 6 a.m. Find the temperature at
A. 68.4° Fahrenheit B. 102.8° Fahrenheit C. 70.4° Fahrenheit D. 71.6° Fahrenheit
Form a polynomial whose zeros and degree are given. Use a leading coefficient of 1. Zeros: -1, 1, - 9; degree 3
A. f(x) = x3 + 9x2 + x + 9 B. f(x) = x3 - 9x2 + x - 9 C. f(x) = x3 - 9x2 - x + 9 D. f(x) = x3 + 9x2 - x - 9