Solve the problem.The following table shows the median number of hours of leisure time that Americans had each week in various years. (i) Use a graphing calculator to fit a quadratic sequence regression function an = an2 + bn + c to the data, where n is the number of years after 1973. (ii) Estimate the median number of leisure hours per week in 2000 and 2010. Round to the nearest hour.
A. (i) an = -0.04x2 + 1.21x + 26.03;
(ii) 30 hours; 16 hours
B. (i) an = 0.04n2 - 1.21n + 26.03;
(ii) 23 hours; 36 hours
C. (i) an = -0.021n2 + 1.44n + 28.07;
(ii) 52 hours; 53 hours
D. (i) an = 0.021x2 - 1.44x + 28.07;
(ii) 4 hours; 4 hours
Answer: B
You might also like to view...
Let  ?
Sketch the region R under the graph of f on the interval [0, 2] and find its exact area using geometry.
?
?
Sketch the region R under the graph of f on the interval [0, 2] and find its exact area using geometry.
?
A. ?
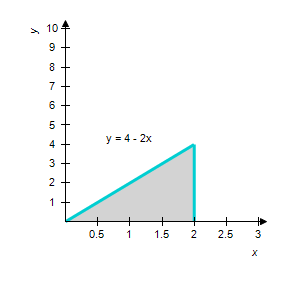
4 sq units;
?
B. ?
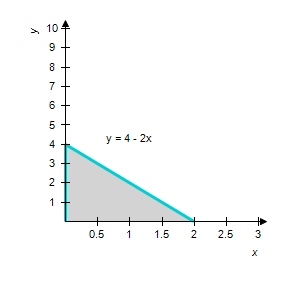
4 sq units;
?
C. ?
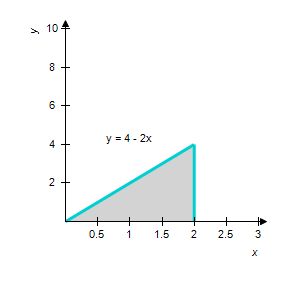
8 sq units;
?
D. ?

8 sq units;
?
A sorority has 27 members, 21 of whom are full members and 6 are pledges. Two persons are selected at random from the membership list of the sorority. Find the probability: the first person selected is a pledge. ?
A. 
B. 
C. 
D. 
E. 
Match the function to its graph.y = -cot 
A. 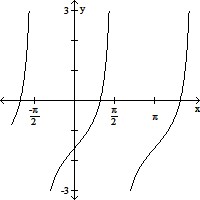
B. 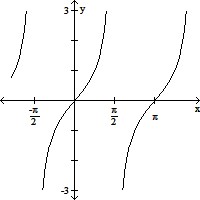
C. 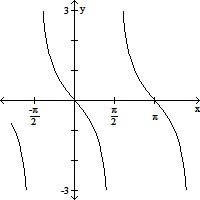
D. 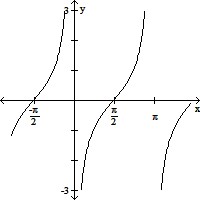
Write the decimal as a percent.Mario saved 0.5 of what he earned over the summer. Write this decimal as a percent.
A. 0.5% B. 0.05% C. 50% D. 500%