In the figure, AD 1 and AS 1 represent the original aggregate supply and demand curves and AD 2 and AS 2 show the new aggregate demand and supply curves. The change in aggregate supply from AS 1 to AS 2 could be caused by:
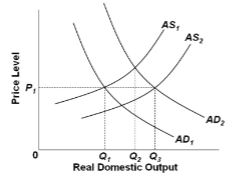
A. a reduction in the price level.
B. the increase in productivity.
C. an increase in business taxes.
D. the real-balances, interest-rate, and foreign purchases effects.
B. the increase in productivity.
You might also like to view...
In terms of exposing others to risk, explain if there is a difference between you choosing to text while driving
and a company selling tablet computers where the batteries have been known to explode when the tablet is left on for a long period of time.
A situation in which the Fed's target interest rate has fallen as far as it can fall is sometimes described as a
a. liquidity preference. b. liquidity trap. c. open-market trap. d. interest-rate contraction.
The convergence theory suggests:
A. all countries eventually will experience the same rate of growth. B. countries may have the same rate of growth but differing levels of income. C. that poorer countries will grow faster than rich ones. D. All of these are true.
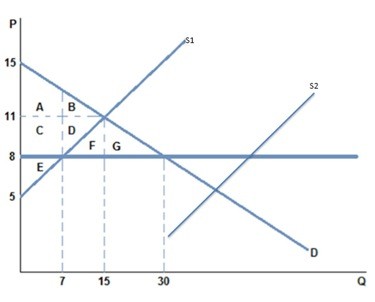 Suppose the market supply is initially at S1 and a price ceiling is set at 8. If supply shifts from S1 to S2, then
A. The price ceiling will no longer bind. B. The market will not reach equilibrium. C. The size of the shortage will increase. D. The price ceiling will prevent output from changing.