Which of the following accurately describes the difference between D2 and D3?
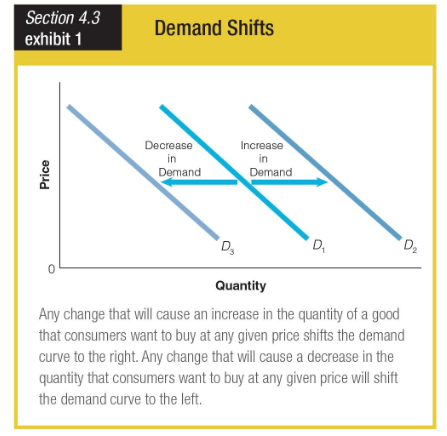
a. D2 shows an increase in demand; D3 show a decrease in demand.
b. D2 shows a decrease in demand; D3 show an increase in demand.
c. D2 shows an increase in price; D3 shows a decrease in price.
d. D2 shows a decrease in price; D3 show an increase in price.
a. D2 shows an increase in demand; D3 show a decrease in demand.
You might also like to view...
Kate and Alice are small-town ready-mix concrete duopolists. The market demand function is Qd = 20,000 - 200P, where P is the price of a cubic yard of concrete and Qd is the number of cubic yards demanded per year. Marginal cost is $80 per cubic yard. The Cournot model describes the competition in this market. How much does Kate produce in the Nash equilibrium?
A. 2,000 B. 1,333.33 C. 800 D. 4,000
The backward-bending supply curve for labor occurs because _____
a. as wages increase, individuals pay higher taxes b. as wages increase, individuals consume more leisure c. as wages increases the number of hours worked increase d. as wages increase, employers cannot afford as many hours
The above figure shows supply and demand curves for milk. If the government passes a $2 per gallon specific tax, the loss in producer surplus will equal
A) b + c + f + g. B) f + g. C) b + f. D) c + g.
The Federal Reserve System was established
a. at the request of farmers to keep down interest rates. b. because Americans believe in centralization of authority. c. after four severe bank panics between 1873 and 1907. d. as part of the Treasury Department.