This graph demonstrates the domestic demand and supply for a good, as well as a quota and the world price for that good.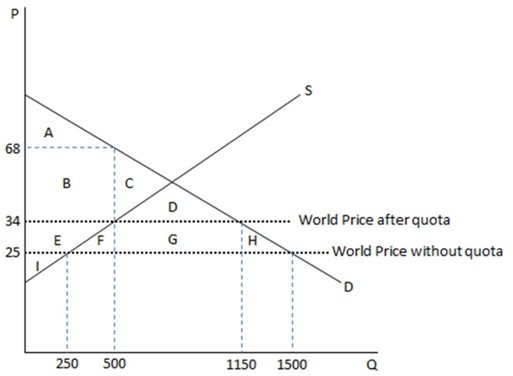 As shown in the graph, when a government imposes a quota, consumer surplus will:
A. increase by EFGH.
B. increase to ABCD.
C. decrease by EFGH.
D. decrease by FG only.
Answer: C
You might also like to view...
Refer to the below graph of the market for low-skilled labor. Sd is the supply of domestic resident workers, and St is the total supply of labor including undocumented workers. What is the equilibrium wage rate and equilibrium employment if there were no illegal immigration?
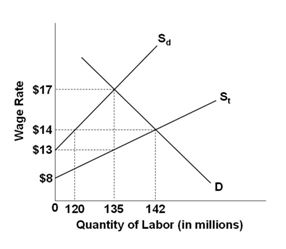
A. $14 and 142M, respectively
B. $13 and 135M, respectively
C. $14 and 120M, respectively
D. $17 and 135M, respectively
Stocks change ________ whereas flows relate to ________
A) and that causes flows to change; changes that have no impact on stocks B) between points in time; changes within a given time period C) within a given period of time; changes between points in time D) only at the end of each year; amounts at a given point in time
Managers should engage in an activity if, on average, it can be done for less that a dollar per unit
Indicate whether the statement is true or false
If Holland decreases subsidies to its tulip growers, the price of tulips in the United States will rise.
Answer the following statement true (T) or false (F)