According to the graph shown, the original world price is _______ and the amount of the tariff is _________.
This graph demonstrates the domestic demand and supply for a good, as well as a tariff and the world price for that good.
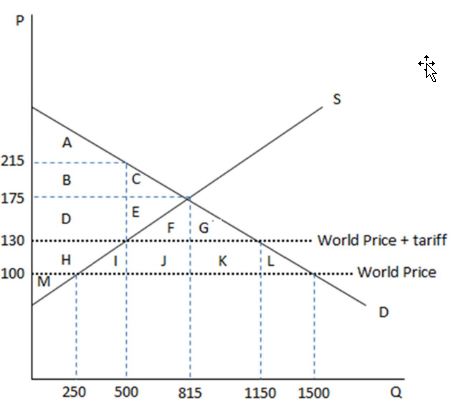
A. $100; $30
B. $100; $130
C. $175; $45
D. $215; $115
A. $100; $30
You might also like to view...
Refer to Figure 9-3. With a quota in place, what is the quantity consumed in the domestic market and what portion of this is supplied by imports?
A) Domestic consumption equals 40 million pounds of which 22 million pounds are imports. B) Domestic consumption equals 34 million pounds of which 18 million pounds are imports. C) Domestic consumption equals 34 million pounds of which 16 million pounds are imports. D) Domestic consumption equals 28 million pounds of which 18 million pounds are imports.
Suppose you have worked at a local sandwich shop for six months and now you plan to ask your manager for a raise. How can you convince your manager that you are worth more money than you are currently being paid?
A) by convincing him that you are a dedicated worker and ready to take on more responsibilities at the shop B) by explaining to him how difficult it is for you to save enough money to go to college C) by demonstrating to your manager the marginal revenue product your employment contributes to the sandwich shop D) by threatening to quit if he refuses to give you a raise
Which of the following is true of firms in both monopolistic competition and perfect competition?
a. Firms face a horizontal demand curve. b. Price exceeds marginal revenue. c. Firms can enter and leave the industry with relative ease. d. Price exceeds marginal cost. e. Products are differentiated.
Monetarists argue that the Federal Reserve should allow the money supply to grow:
A. counter to the business cycles. B. faster than 10 percent annually. C. only during recessions. D. at a constant rate.