Plot and interpret the appropriate scatter diagram.The table gives the times spent watching TV and the grades of several students. 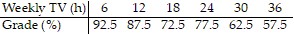 Which scatter diagram describes the data and the relationship, if any?
A. 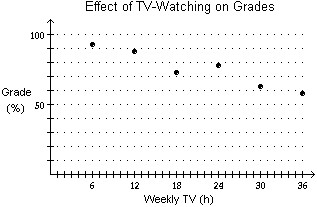
More hours spent watching TV may reduce grades.
B. 
More hours spent watching TV may reduce grades.
C. 
More hours spent watching TV may increase grades.
D. none of these
Answer: A
You might also like to view...
Find the integral.
A. 2.68 B. 6.68 C. 4.6 D. 0.68
Write the equation of a polynomial function with the given characteristics. Use a leading coefficient of 1 or -1 and make the degree of the function as small as possible.Crosses the x-axis at -1, 0, and 4; lies below the x-axis between -1 and 0; lies above the x-axis between 0 and 4.
A. f(x) = x3 + 3x2 - 4x B. f(x) = - x3 - 3x2 + 4x C. f(x) = -x3 + 3x2 + 4x D. f(x) = x3 - 3x2 - 4x
Find a quadratic equation whose solution set is given.
A. 6x2 + 35x + 6 = 0 B. 6x2 + 6x + 35 = 0 C. 6x2 + 35x - 36 = 0 D. 6x2 + 35x + 36 = 0
The bar graph below shows the number of students by major in the College of Arts and Sciences. Answer the question. What is the average number of students taking Science, History, and Math? Round your answer to the nearest whole student if necessary.
A. 283 students B. 163 students C. 217 students D. 750 students