Use the line graph to answer the question.The line graph shows the 2001 sales data for the Big "D" company. 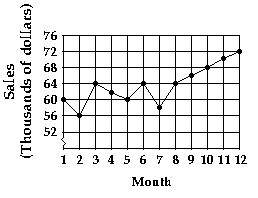 Find the decrease in sales between month 3 to month 5.
A. $400
B. $4000
C. $2000
D. $1000
Answer: B
Mathematics
You might also like to view...
Find a quadratic equation whose solution set is given.{-2, 2}
A. x2 - 4x + 4 = 0 B. x2 + 4x + 4 = 0 C. x2 - 2 = 0 D. x2 - 4 = 0
Mathematics
Graph the polar equation.r = 2?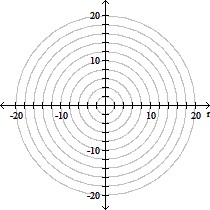
A. 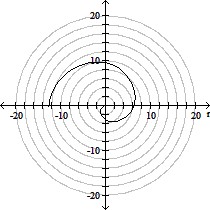
B. 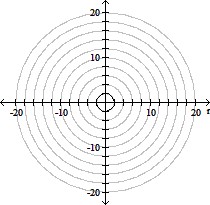
C. 
D. 
Mathematics
Perform the desired operation. Write the answer in the form a + bi.(6 + 7i)(6 - 7i)
A. 85 B. -13 C. 36 - 49i2 D. 36 - 49i
Mathematics
Name the place that the underlined digit occupies.0.52
A. Ones B. Ten-thousandths C. Thousandths D. Hundredths
Mathematics