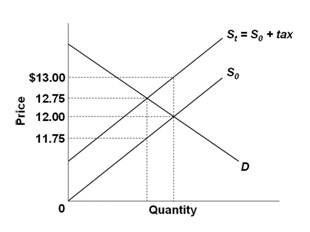
Refer to the below graph. It shows the supply curve for a product before tax (S0) and after an excise tax is imposed (S1). If 500 units of the product are sold after the tax is imposed, the amount of tax revenue going to the government is:
A. $125
B. $250
C. $375
D. $500
D. $500
You might also like to view...
An optimizing economic agent will use the ________ rate while calculating the economic cost of a loan
A) exchange B) nominal interest C) real interest D) tax
Which of the following is the most important source of external financing for corporations?
A) stock market B) bond market C) retained earnings D) mortgages
The effect of an import quota on the domestic market is to shift the:
a. demand curve to the right by the amount of the quota. b. demand curve to the left by the amount of the quota. c. supply curve to the right by the amount of the quota. d. supply curve to the left by the amount of the quota. e. consumers' marginal utility curves if they prefer foreign goods to domestic goods.
Firms in a small economy planned that inventories would grow over the past year by $500,000. Over that year, inventories did grow by exactly $500,000. This implies that
What will be an ideal response?