The table shows, for some particular year, a listing of several income levels and, for each level, the proportion of the population in the level and the probability that a person in that level bought a new car during the year. Given that one of the people who bought a new car during that year is randomly selected, find the probability that that person was in the indicated income category. Round your answer to the nearest hundredth. 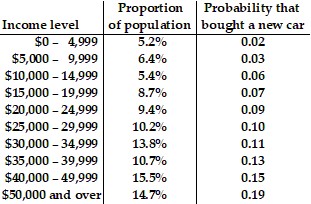 $30,000 - $39,999
A. 0.03
B. 0.26
C. 0.14
D. 0.13
Answer: B
Mathematics
You might also like to view...
Without graphing, find the vertex.f(x) = 6 2 - 6.76
A. 
B. 
C. 
D. 
Mathematics
Complete.67.95 m =  km
km
A. 6,795 B. 0.6795 C. 0.06795 D. 67,950
Mathematics
Find the value of 104.
a. 100 b. 1,000 c. 10,000 d. 100,000 e. 1,000,000
Mathematics
Find the exact value, given that  with ? in
  and
and  with ? in
  cos (? + ?)
A. 
B. 
C. 
D. 
Mathematics