Prepare a graph showing the effect of subcooling between 0 and 50°C on the maximum heat flux calculated in Problem 9.8.
GIVEN
FIND
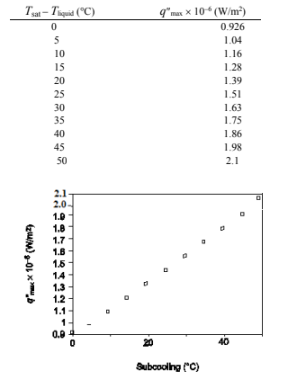
? Prepare a graph showing the effect of sub cooling (Tsat – Tliquid) between 0 and 50°C on q"max
ASSUMPTIONS
? Steady state conditions
? Nucleate pool boiling
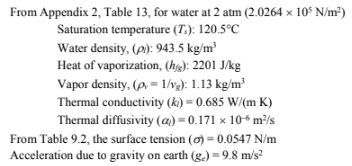
PROPERTIES AND CONSTANTS
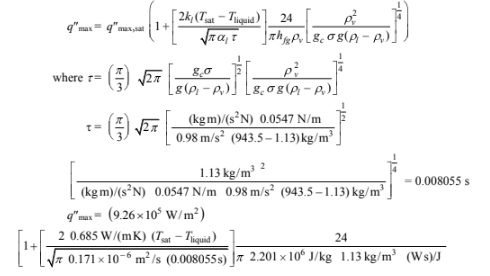
For subcooling, the effect on the maximum heat flux is given by Equation (9.5)
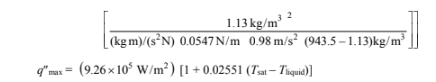
This is tabulated and graphed fro different values of (Tsat – Tliquid) below
You might also like to view...
This graph shows the brightness of a star over the course of a transit. Which of the following do we learn about the planet? "
A) It is large enough to block about 2.5% of the star's light. B) It has an orbital period of less than 2 hours. C) It is about 2.5% as massive as the star. D) It is about 97.5% as bright as its star.
The belts of Jupiter are best described as follows
A) regions of downward moving material and low pressure. B) regions of upward moving material and low pressure. C) regions of upward moving material and high pressure. D) regions of downward moving material and high pressure. E) turbulent regions with no organized circulation pattern.
The absorption lines we find in quasar redshifts that arise from intervening gas clouds show even larger redshifts than the quasar spectra, due to dust absorption
Indicate whether the statement is true or false
During an isothermal process, 5.0 J of heat is removed from an ideal gas. What is the work done in the process?
A) zero B) 2.0 J C) 5.0 J D) -5.0 J E) none of the above