The following double-bar graph illustrates the revenue for a company for the four quarters of the year for two different years. Use the graph to answer the question. 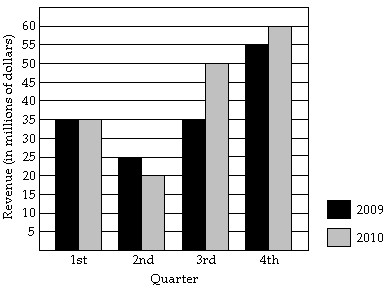 Which quarter for 2010 had the greatest decrease in revenue compared to the same quarter for 2009?
A. second quarter
B. first quarter
C. fourth quarter
D. third quarter
Answer: A
Mathematics
You might also like to view...
Solve.x3 + 2x2 - 4x ? 8
A. [2, ?) B. [-2, 2] C. (-?, 2] D. (-?, -2] ? [2, ?)
Mathematics
Multiply.(2x + 7)(x + 8)
A. x2 + 23x + 22 B. 2x2 + 23x + 56 C. 2x2 + 22x + 56 D. x2 + 56x + 23
Mathematics
Provide an appropriate response.Solve for x: ln x + ln 3 = ln(x + 1)
Fill in the blank(s) with the appropriate word(s).
Mathematics
The graph of a function f is given. Use the graph to answer the question.Use the graph of f given below to find f(10).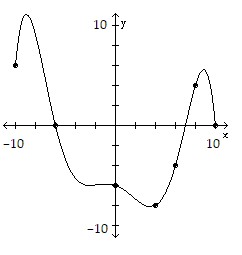
A. 12 B. 20 C. 0 D. 10
Mathematics