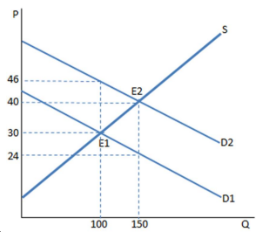
The graph shown portrays a subsidy to buyers. The amount of money spent on this subsidy by the government is:
A. $3,600.
B. $2,400.
C. $6,000.
D. $800.
B. $2,400.
You might also like to view...
The figure illustrates the market for posters. The tax on a poster is ________ and the government's tax revenue from the sale of posters is ________ a month
A) $0.50; $150 B) $0.35; $105 C) $0.35; $200 D) $0.35; $140
The only goods you consume are pizza and soda. Both are normal goods. For you, pizza and soda are substitutes. Which of the following leads you to buy more of both goods?
A) The price of a pizza falls. B) The price of a soda falls. C) Your income increases. D) Both answers A and B are correct.
If Spain is capable of producing either tapas or soccer balls or some combination of those two products, then Spain should:
A. produce the good it has an absolute advantage in producing. B. produce the good it has a comparative advantage in producing. C. remain self-sufficient if it can produce both efficiently. D. trade only if it possesses the absolute advantage in the production of both goods.
Marginal cost is:
a) Total revenue minus total cost. b) The change in total costs because of a one-unit increase in output. c) Total cost divided by the rate of output. d) The average profit divided by the quantity sold.