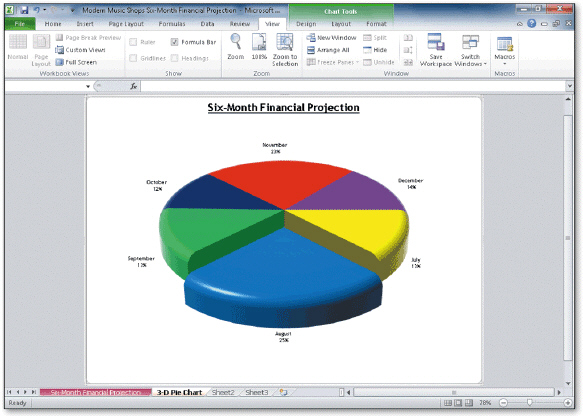
 Using the accompanying figure, identify the following chart elements: chart sheet, chart title, Pie chart, data series, category names, exploded slice, and data labels.
What will be an ideal response?
1. The chart sheet is a separate sheet named 3-D Pie Chart that contains only the chart.
2. The chart title is the Six-Month Financial Projection text above the Pie chart.
3. The Pie chart is the six-slice chart in the middle of the chart sheet that visually illustrates the data series.
4. A data series is the range of values being charted in the Pie chart.
5. The category names identify the slices of the Pie chart: the month names from July through December.
6. The August Pie chart slice is exploded or moved away from the other slices to draw attention to it.
7. The data labels supply the month name and percentage of the whole information for the Pie chart.
You might also like to view...
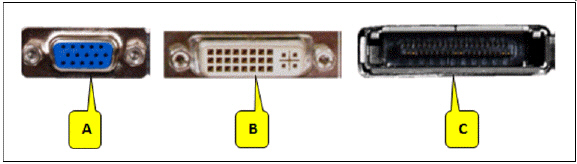 Referring to the accompanying figure, which callout points to the HDMI port?
A. A B. B C. C D. None of the above
After dividing the numbers, the ____ operator returns the remainder of the division.
A. division B. modulus C. remainder D. integer division
The _____ allows the core of a computer to communicate with other CPU components, such as the memory controller and other cores.
A. ?prefetch unit B. ?decode unit C. ?bus interface unit D. ?control unit
What is the format of a X.500 distinguished name?
What will be an ideal response?