Answer the question.The bar graph below shows the average cost of renting a studio in a certain city in each of the years 1994 through 1998. 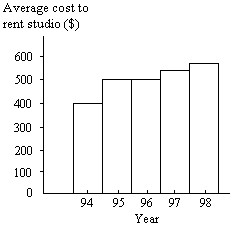 By what percentage does the average rental price increase from 1994 to 1995? Obtain a truncated version of the graph by sliding a piece of paper over the bottom portion of the graph so that the scale on the vertical axis starts
  In the truncated graph, by what percentage does the price appear to increase from 1994 to 1995? Why is the truncated graph misleading?
What will be an ideal response?
Answers will vary. Possible answer: The average price increases  from 1994 to 1995. Using the truncated graph, the price appears to double from 1994 to 1995 (i.e. it appears to increase
  Using the truncated graph, the differences between the bars appear bigger (relatively) than they really are.
You might also like to view...
Perform the operation indicated. ?
? 
A. 
B. 
C. 1
D. 
Use substitution to determine whether the given ordered pair is a solution of the given equation.(4, 3); x2 + y2 = 25
A. Yes B. No
Use a calculator to find the approximate value of the expression rounded to two decimal places.cos 9
A. 0.99 B. -0.99 C. -0.91 D. 0.91
Three people are asked their opinions on a political issue. They can answer Opposed (O) or Undecided (U). Find the sample space S. ?
A. {OOO, OOU, OUO, UOO, UUU, UUO, UOU} B. {OOO, OOU, UOO, UUU, UUO, UOU, OUU} C. {OOO, OOU, OUO, UOO, UUO, UOU, OUU} D. {OOO, OUO, UOO, UUO, UOU, OUU} E. {OOO, OOU, OUO, UOO, UUU, UUO, UOU, OUU}